

Healthcare royalties company Royalty Pharma (NASDAQ:RPRX) fell short of the market’s revenue expectations in Q2 CY2025, but sales rose 7.8% year on year to $579 million. Its GAAP profit of $0.16 per share was in line with analysts’ consensus estimates.
Is now the time to buy Royalty Pharma? Find out by accessing our full research report, it’s free.
Royalty Pharma (RPRX) Q2 CY2025 Highlights:
- Revenue: $579 million vs analyst estimates of $590 million (7.8% year-on-year growth, 1.9% miss)
- EPS (GAAP): $0.16 vs analyst estimates of $0.17 (in line)
- Adjusted EBITDA: $633 million vs analyst estimates of $606.6 million (109% margin, 4.4% beat)
- Free Cash Flow was $364 million, up from -$138.6 million in the same quarter last year
- Market Capitalization: $15.97 billion
“We delivered excellent second quarter 2025 results, as the strength of our diversified portfolio drove 20% growth in Portfolio Receipts, and raised our full year guidance,” said Pablo Legorreta, Royalty Pharma’s founder and Chief Executive Officer.
Company Overview
Pioneering a unique business model in the pharmaceutical industry since 1996, Royalty Pharma (NASDAQ:RPRX) acquires rights to receive portions of sales from successful biopharmaceutical products, providing funding to drug developers without conducting research itself.
Revenue Growth
A company’s long-term sales performance can indicate its overall quality. Any business can put up a good quarter or two, but the best consistently grow over the long haul. Regrettably, Royalty Pharma’s sales grew at a tepid 3.6% compounded annual growth rate over the last five years. This wasn’t a great result compared to the rest of the healthcare sector, but there are still things to like about Royalty Pharma.
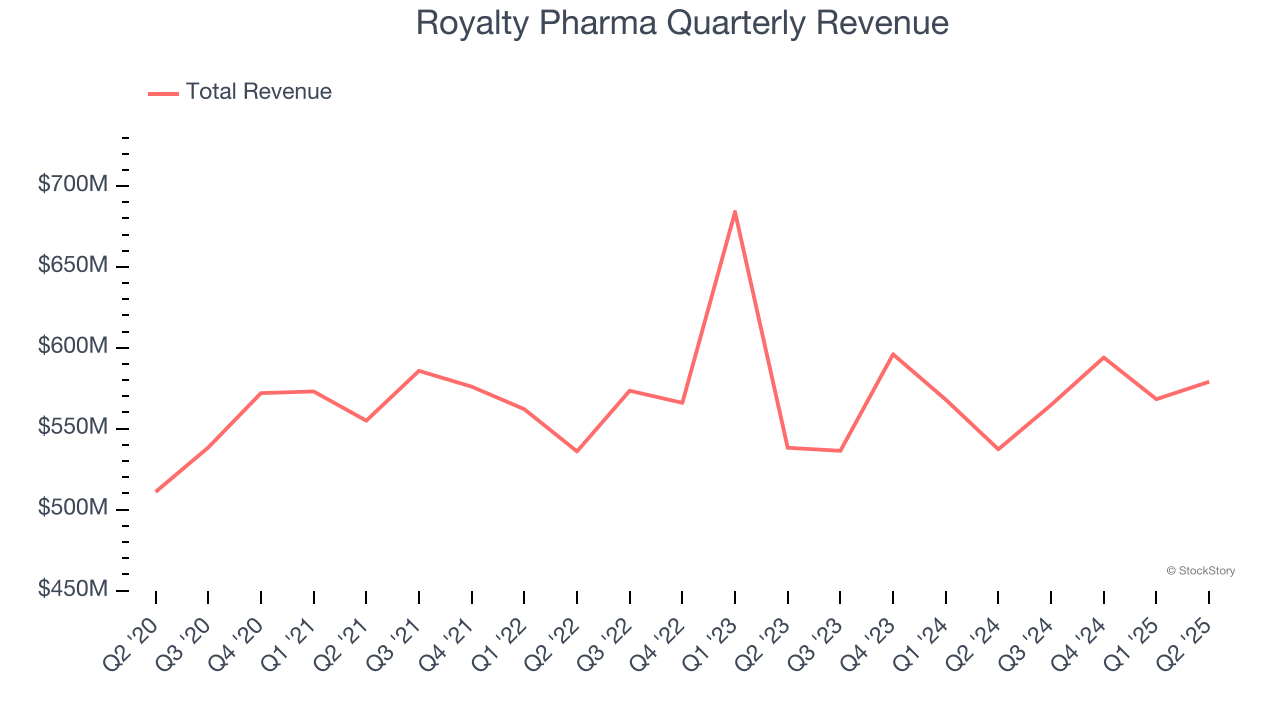
We at StockStory place the most emphasis on long-term growth, but within healthcare, a half-decade historical view may miss recent innovations or disruptive industry trends. Royalty Pharma’s performance shows it grew in the past but relinquished its gains over the last two years, as its revenue fell by 1.2% annually. 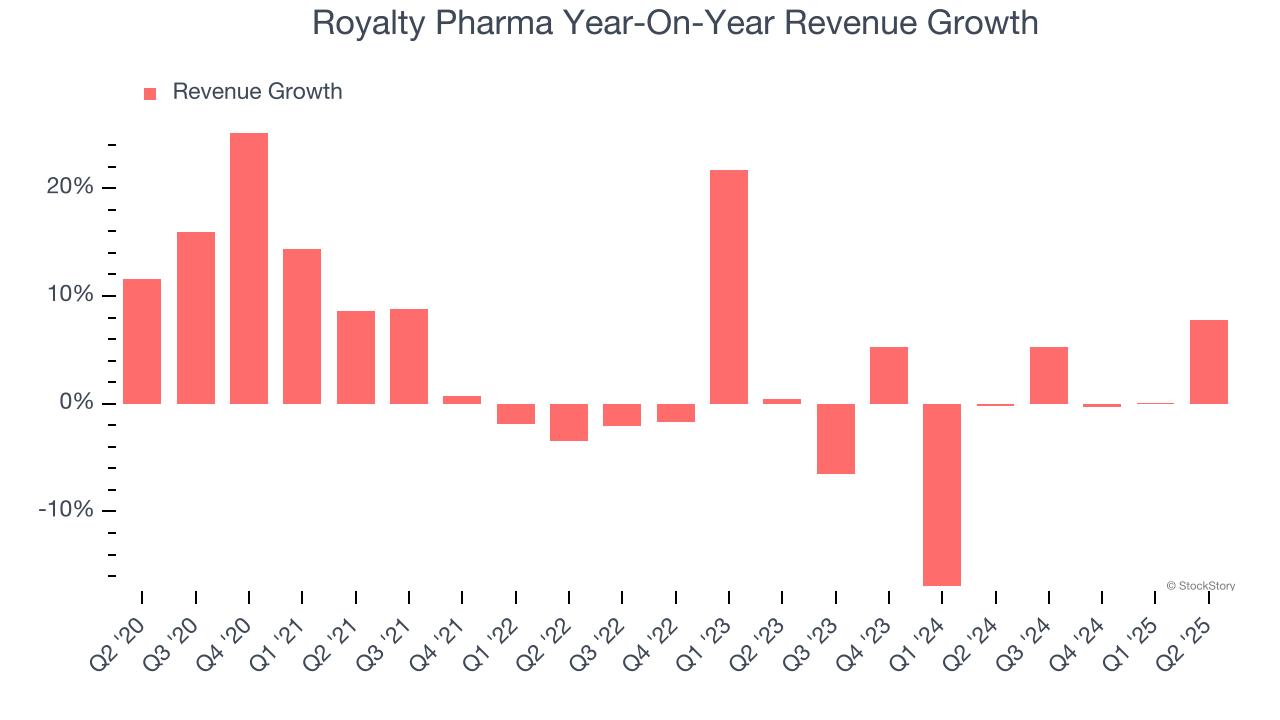
We can better understand the company’s revenue dynamics by analyzing its most important segment, Portfolio Receipts. Over the last two years, Royalty Pharma’s Portfolio Receipts revenue averaged 11.8% year-on-year growth. This segment has outperformed its total sales during the same period, lifting the company’s performance. 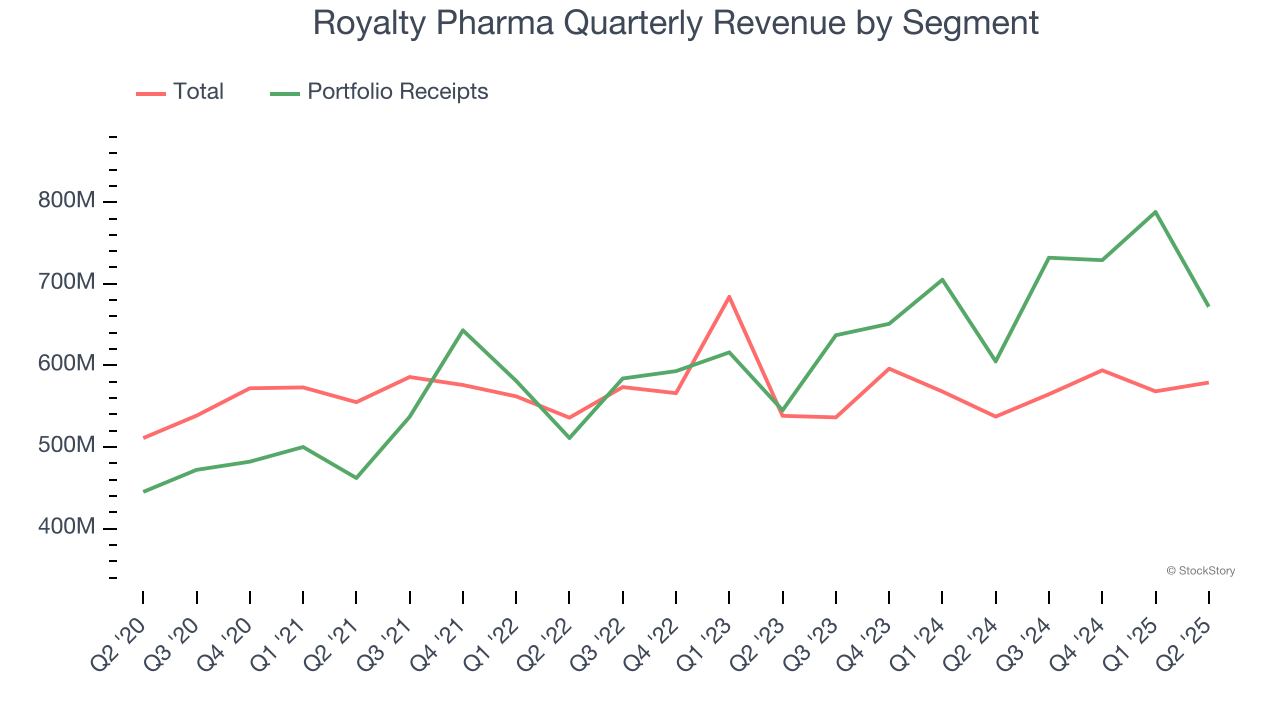
This quarter, Royalty Pharma’s revenue grew by 7.8% year on year to $579 million, missing Wall Street’s estimates.
Looking ahead, sell-side analysts expect revenue to grow 26.4% over the next 12 months, an improvement versus the last two years. This projection is eye-popping and implies its newer products and services will catalyze better top-line performance.
Unless you’ve been living under a rock, it should be obvious by now that generative AI is going to have a huge impact on how large corporations do business. While Nvidia and AMD are trading close to all-time highs, we prefer a lesser-known (but still profitable) stock benefiting from the rise of AI. Click here to access our free report one of our favorites growth stories.
Operating Margin
Operating margin is a key measure of profitability. Think of it as net income - the bottom line - excluding the impact of taxes and interest on debt, which are less connected to business fundamentals.
Royalty Pharma has been a well-oiled machine over the last five years. It demonstrated elite profitability for a healthcare business, boasting an average operating margin of 54.3%.
Looking at the trend in its profitability, Royalty Pharma’s operating margin rose by 31.9 percentage points over the last five years, as its sales growth gave it operating leverage. This performance was mostly driven by its recent improvements as the company’s margin has increased by 84.1 percentage points on a two-year basis.
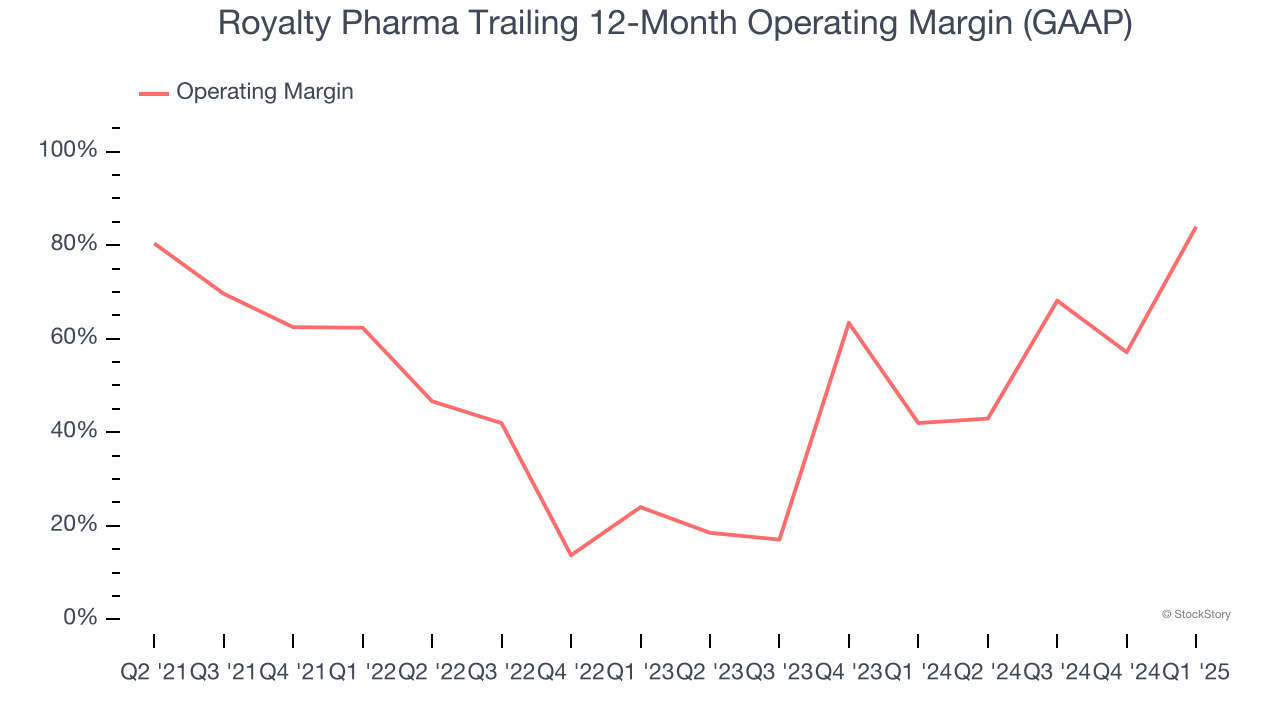
in line with the same quarter last year. This indicates the company’s overall cost structure has been relatively stable.
Earnings Per Share
Revenue trends explain a company’s historical growth, but the long-term change in earnings per share (EPS) points to the profitability of that growth – for example, a company could inflate its sales through excessive spending on advertising and promotions.
Sadly for Royalty Pharma, its EPS declined by 17.3% annually over the last five years while its revenue grew by 3.6%. However, its operating margin actually improved during this time, telling us that non-fundamental factors such as interest expenses and taxes affected its ultimate earnings.
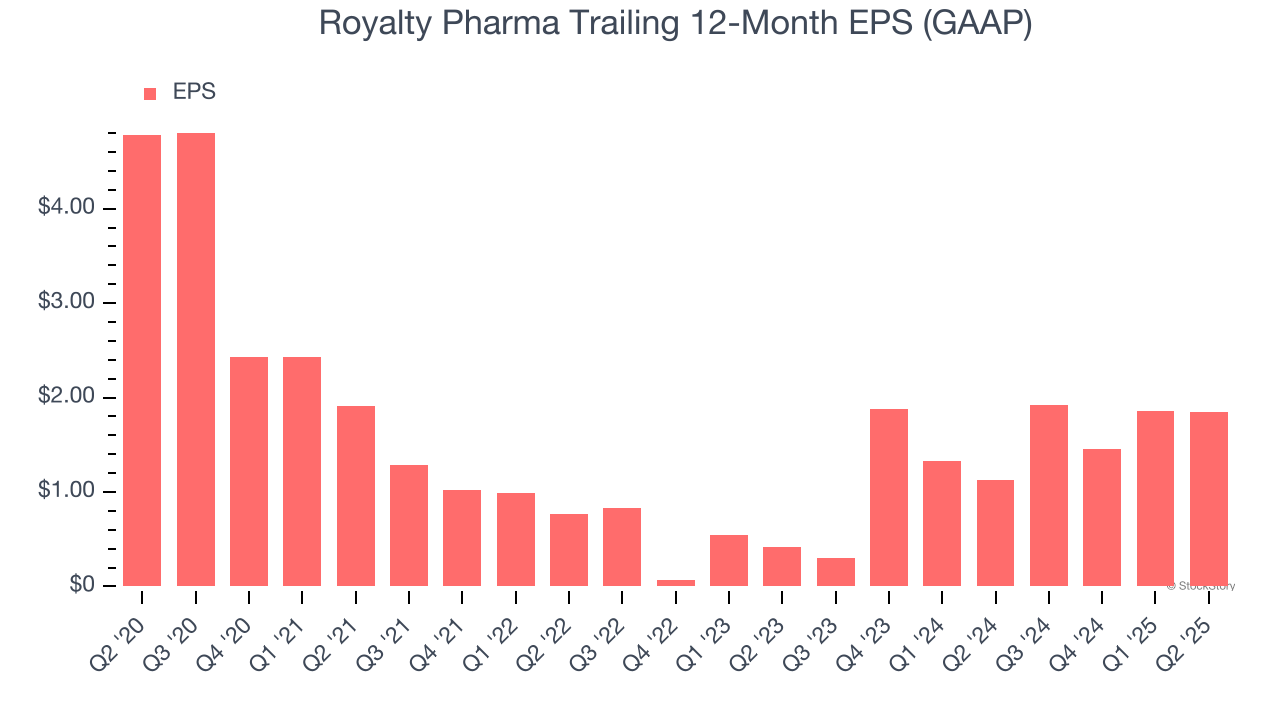
Diving into the nuances of Royalty Pharma’s earnings can give us a better understanding of its performance. A five-year view shows Royalty Pharma has diluted its shareholders, growing its share count by 58.8%. This dilution overshadowed its increased operating efficiency and has led to lower per share earnings. Taxes and interest expenses can also affect EPS but don’t tell us as much about a company’s fundamentals. 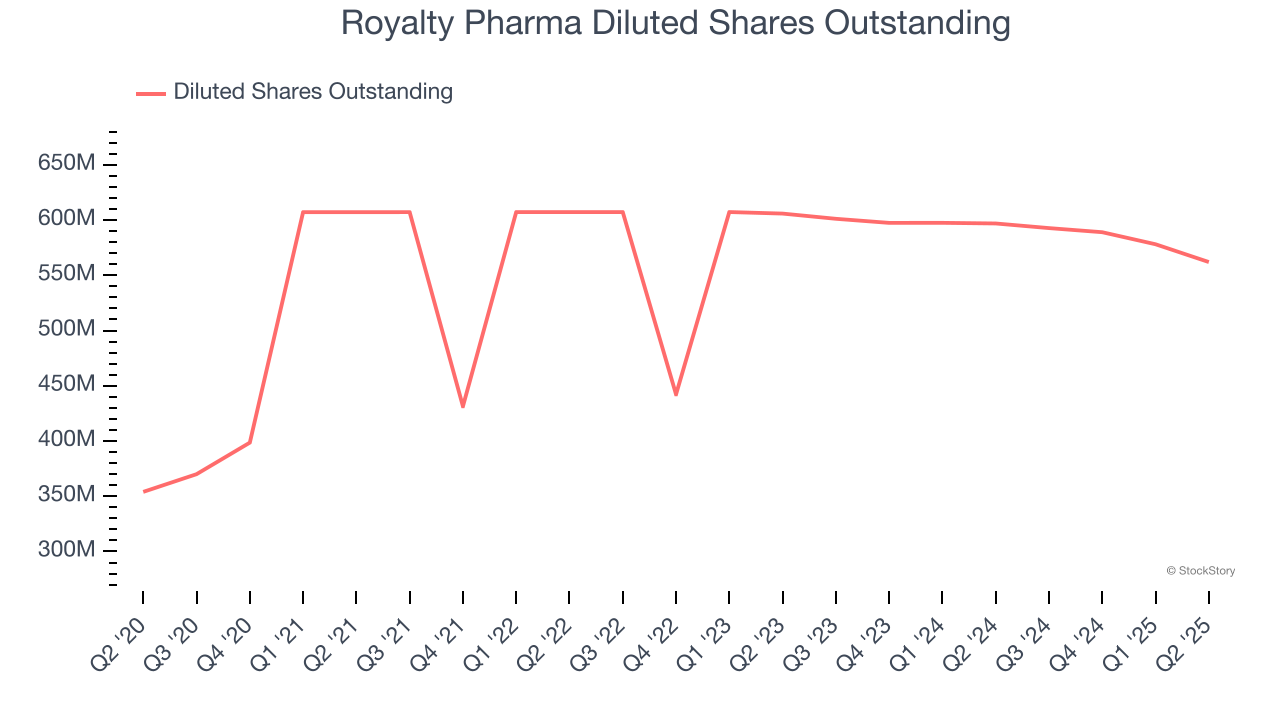
In Q2, Royalty Pharma reported EPS at $0.16, in line with the same quarter last year. This print missed analysts’ estimates. We also like to analyze expected EPS growth based on Wall Street analysts’ consensus projections, but there is insufficient data.
Key Takeaways from Royalty Pharma’s Q2 Results
We struggled to find many positives in these results. Its EPS missed and its revenue fell short of Wall Street’s estimates. Overall, this was a weaker quarter. The stock traded down 1.7% to $37.25 immediately after reporting.
Royalty Pharma’s latest earnings report disappointed. One quarter doesn’t define a company’s quality, so let’s explore whether the stock is a buy at the current price. We think that the latest quarter is only one piece of the longer-term business quality puzzle. Quality, when combined with valuation, can help determine if the stock is a buy. We cover that in our actionable full research report which you can read here, it’s free.